Face-On View of Milky Way
Introduction
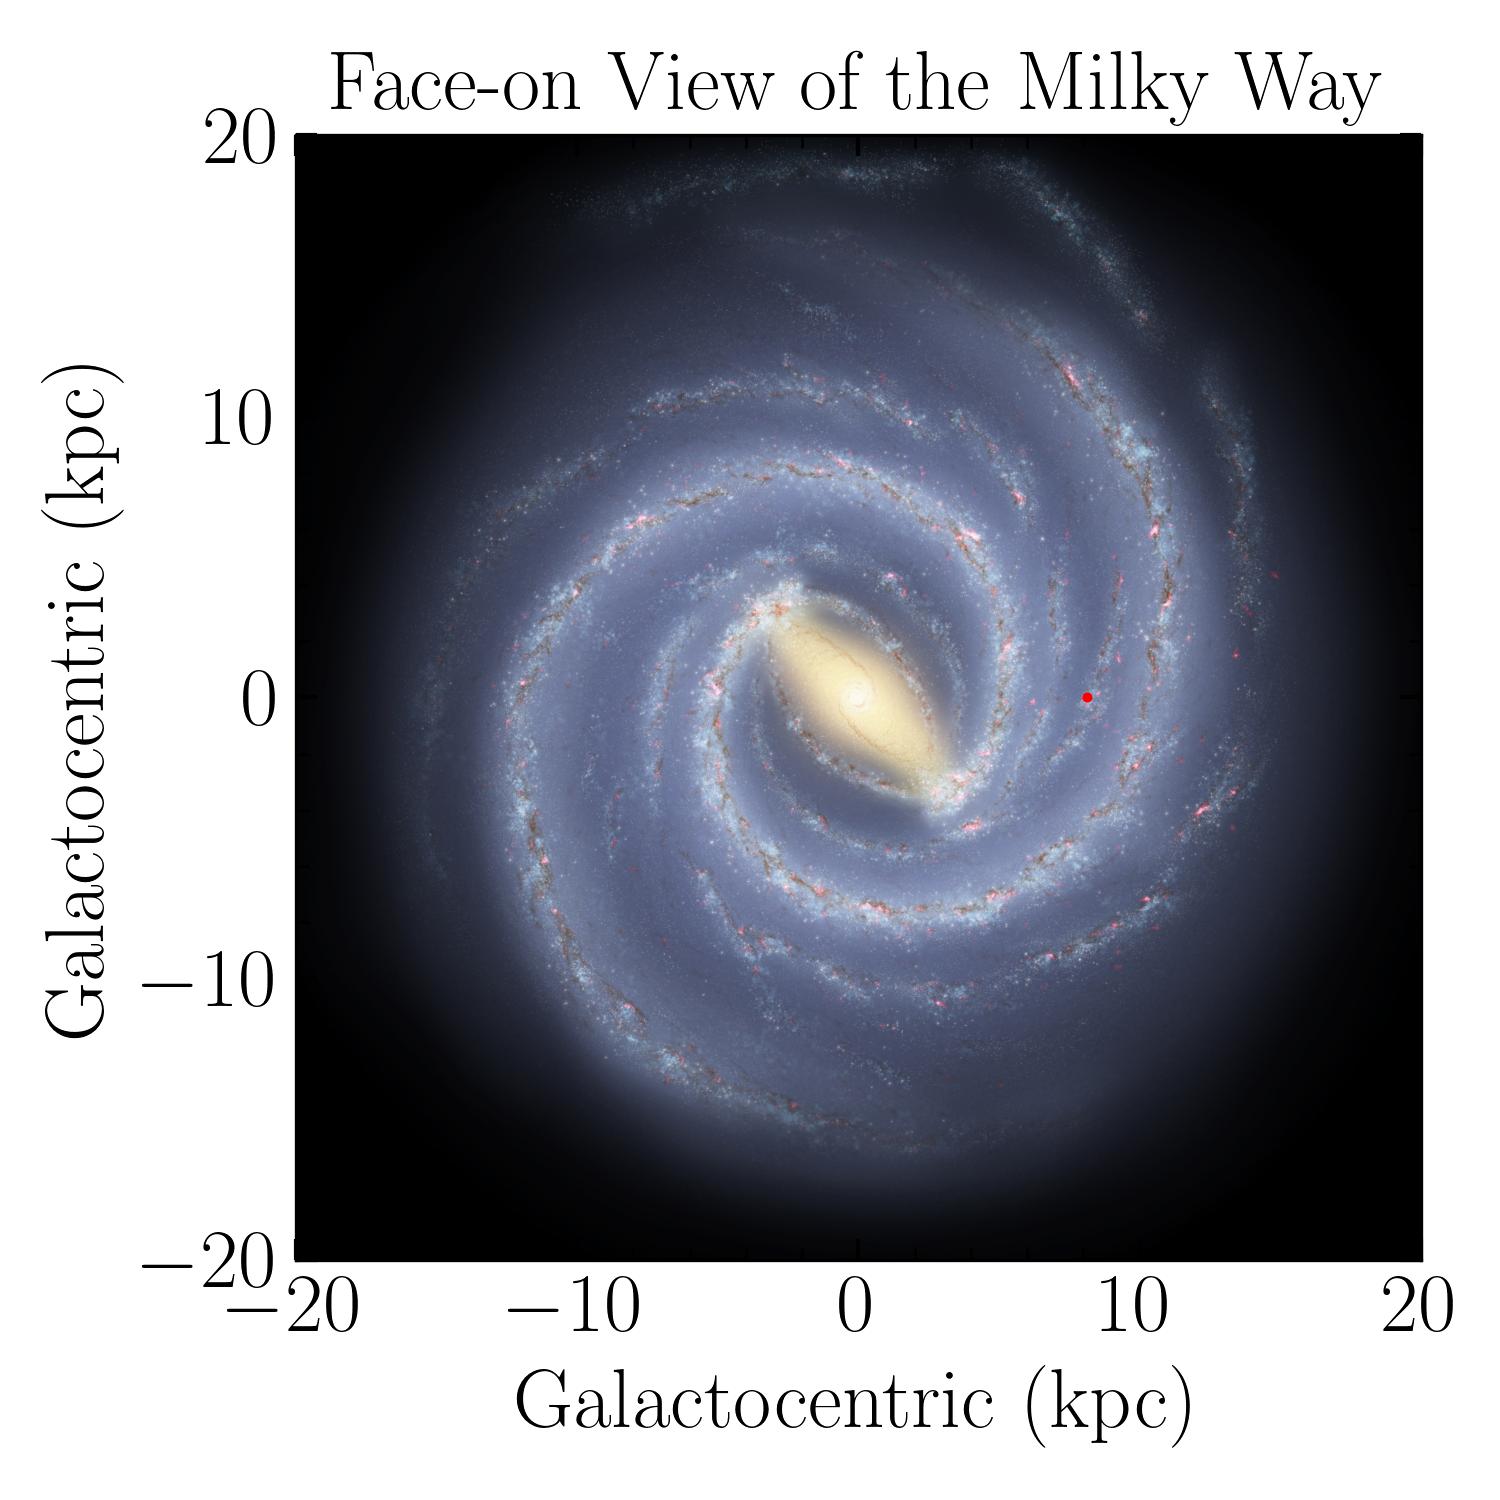
MWFaceOn class is a wrapper around the matplotlib library to plot the face-on view of
the Milky Way. It provides a simple interface to plot the face-on view of the Milky Way.
MilkyWay Bird’s Eye
>>> import numpy as np
>>> from astropy import units as u
>>> from mw_plot import MWFaceOn

>>> mw1 = MWFaceOn(
...     radius=20 * u.kpc,
...     unit=u.kpc,
...     coord="galactocentric",
...     annotation=True,
...     figsize=(10, 8),
... )
>>> mw1.title = "Bird's Eyes View"
>>> mw1.scatter(8 * u.kpc, 0 * u.kpc, c="r", s=2)
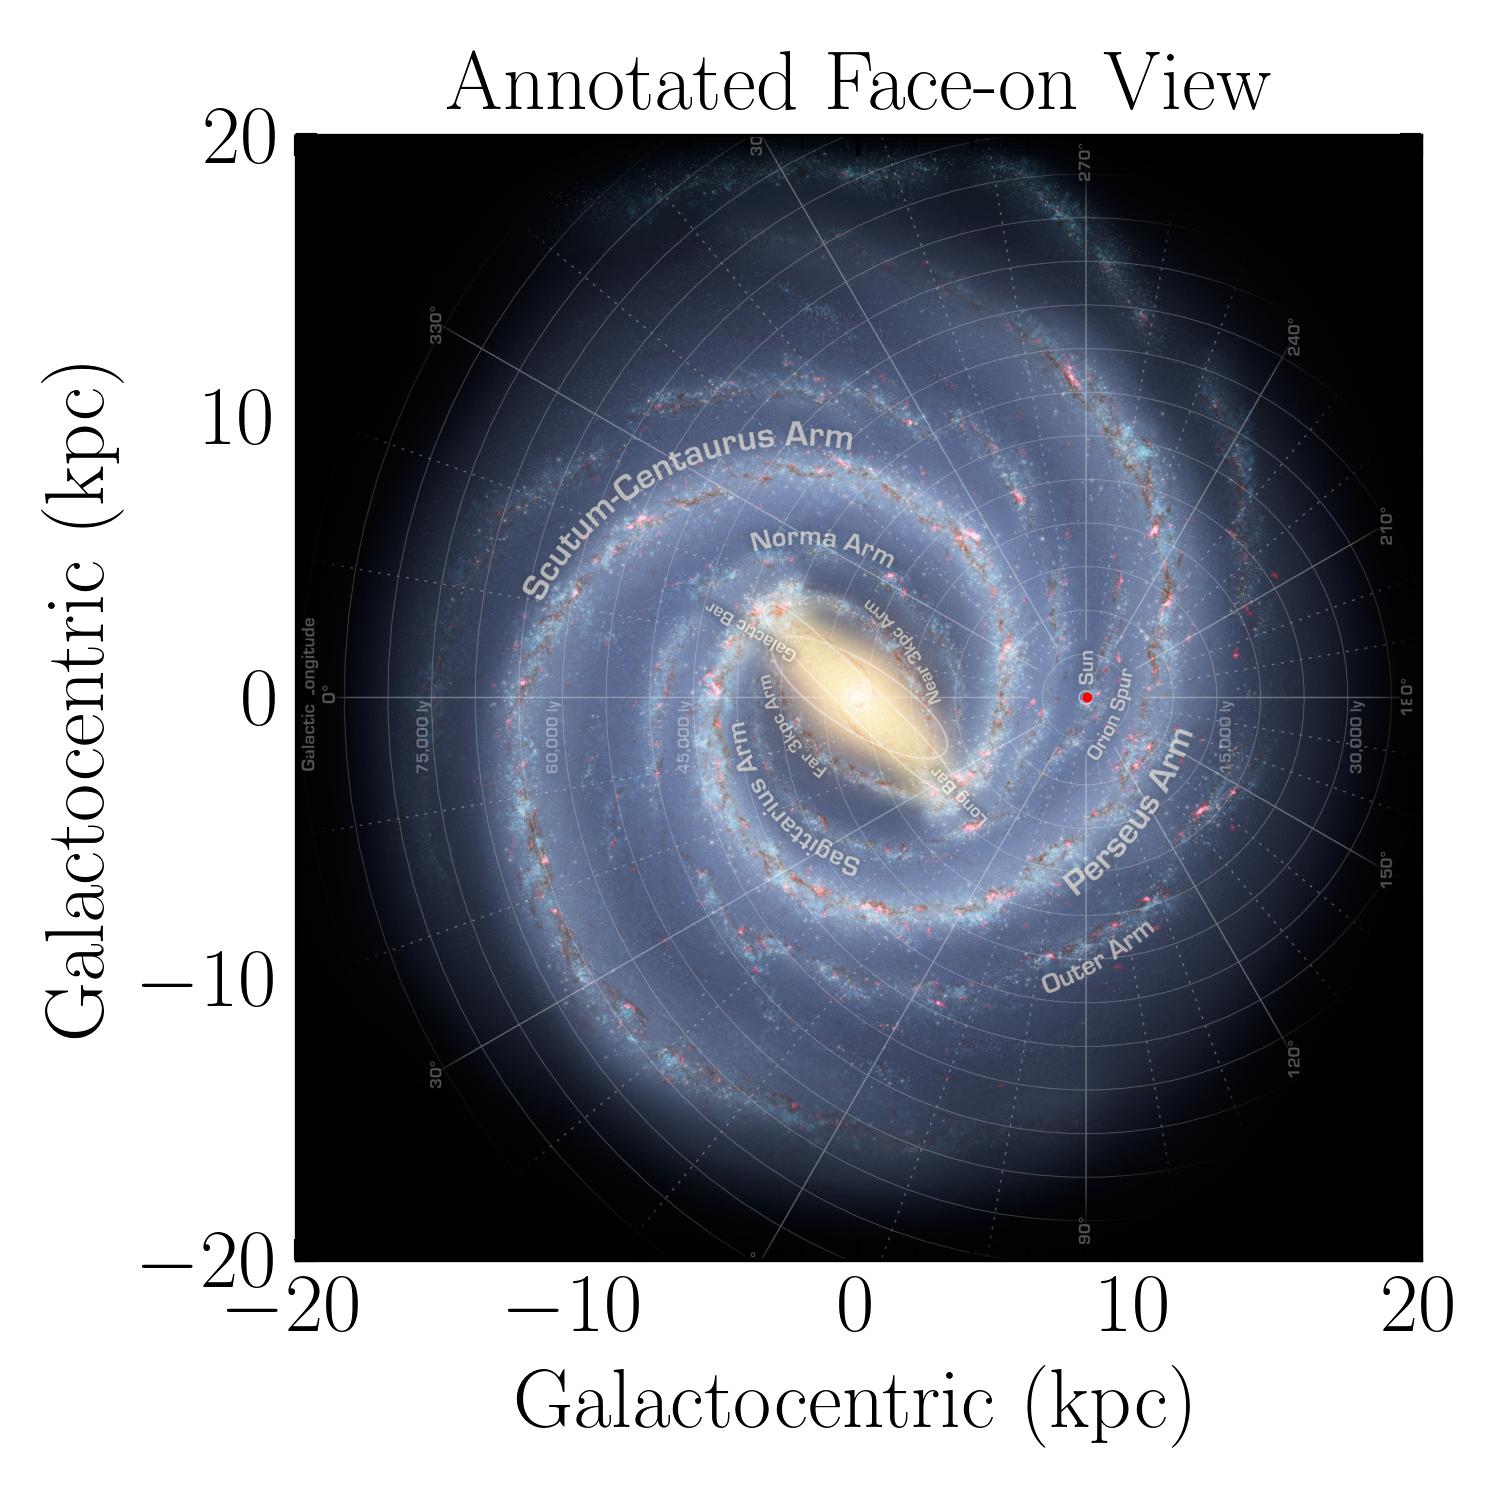
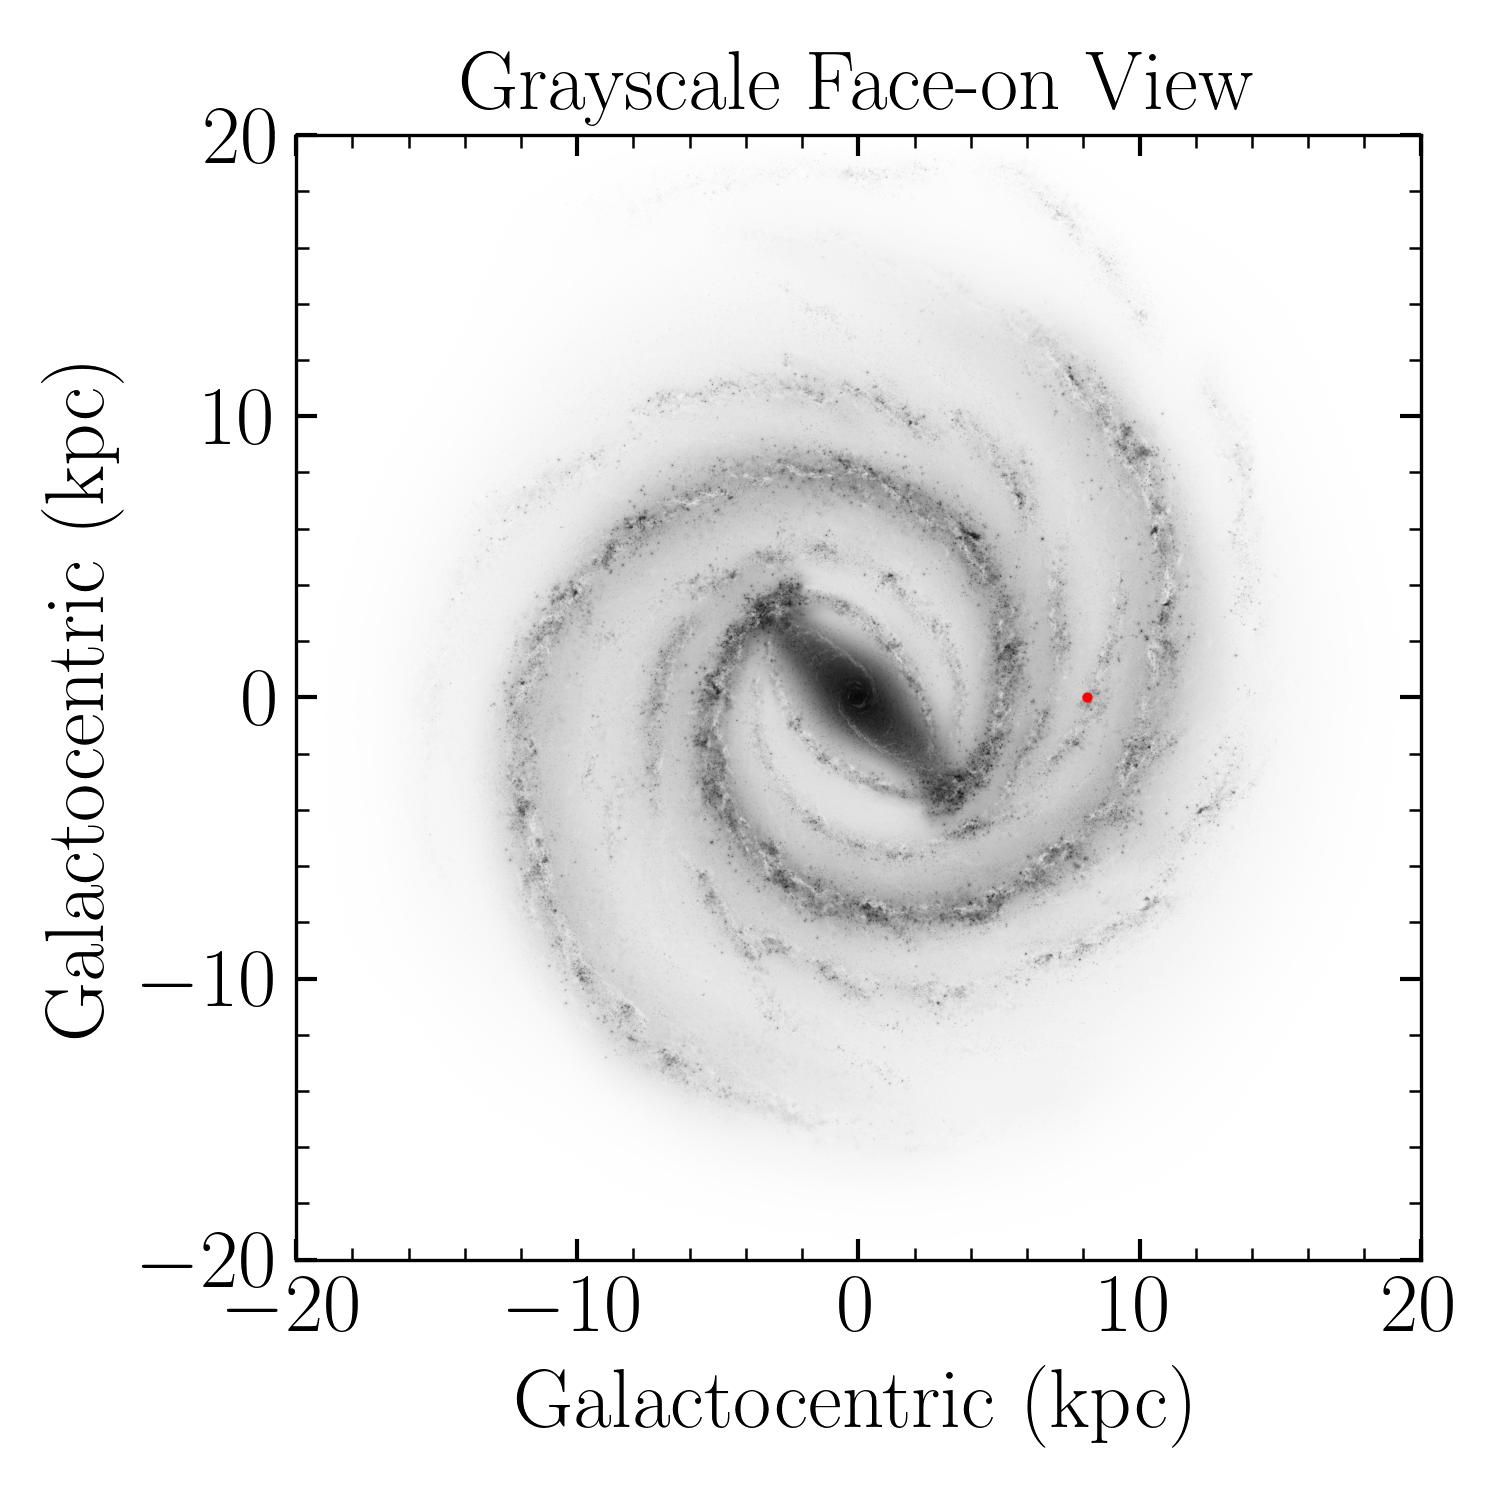
Annotation and Grayscale
If you set annotation to True, the annotation of the Milky Way components will be shown.
If you set grayscale to True, the image will be shown in grayscale.
Coordinates and units
Class API
- class mw_plot.MWFaceOn(grayscale: bool = False, annotation: bool = False, angle: int = 90, r0: ~astropy.units.quantity.Quantity = <Quantity 8.125 kpc>, coord: str = 'galactic', center: tuple = (0.0, 0.0), radius: ~astropy.units.quantity.Quantity = <Quantity 20. kpc>, unit: ~astropy.units.core.Unit = Unit("kpc"), figsize: tuple = (5, 5))[source]
MWPlot class plotting with Matplotlib
Parameters
- grayscalebool, optional
Whether to use grayscale background. The default is False.
- annotationbool, optional
Whether to show annotation. The default is False.
- angleint, optional
Angle of the plot. The default is 90.
- r0astropy.Quantity, optional
Distance to the Galactic center. The default is 8.125*u.kpc.
- coordstr, optional
Coordinate system. The default is “galactic”.
- centertuple, optional
Center of the plot. The default is (0.0, 0.0).
- radiusastropy.Quantity, optional
Radius of the plot. The default is 20.0*u.kpc.
- unitastropy.Unit, optional
Unit of the plot. The default is u.kpc.
- figsizetuple, optional
Matplotlib figure size. The default is (5, 5).
- annotate(*args, **kwargs)[source]
Plot annotation
- History:
2022-Jan-02 - Written - Henry Leung (University of Toronto)
- initialize_mwplot(fig=None, ax=None, _multi=False)[source]
Internal method to initial mw_plot images and plot
- Returns:
None
- mw_scatter(x, y, c='r', **kwargs)[source]
Plot scatter points with colorbar
- Parameters:
x (astropy.Quantity) – Scatter points x-coordinates on the plot
y (astropy.Quantity) – Scatter points y-coordinates on the plot
c (Union[str, list, ndarry]) – Scatter points color
- History:
2018-Mar-17 - Written - Henry Leung (University of Toronto)