Single Plot
Classes API
- class mw_plot.MWPlot(mode='face-on', center=<Quantity [0., 0.] kpc>, radius=<Quantity 90750. lyr>, unit=Unit("kpc"), coord='galactic', annotation=True, rot90=0, grayscale=False, r0=8.125, figsize=(7.5, 7.5), dpi=None)[source]
MWPlot class plotting with Matplotlib
- Parameters:
mode (str, either 'face-on' or 'edge-on') – whether plot edge-on or face-on milkyway
center (astropy.Quantity) – Coordinates of the center of the plot with astropy units
radius (astropy.Quantity) – Radius of the plot with astropy units
unit (astropy.Quantity) – astropy units
coord (str) – ‘galactocentric’ or ‘galactic’
annotation (bool) – whether use a milkyway background with annotation
rot90 (int) – number of 90 degree rotation
grayscale (bool) – whether to use grayscale background
r0 (float) – distance to galactic center in kpc
figsize (turple) – Matplotlib figure size
dpi (int) – Matplotlib figure dpi
- annotate(*args, **kwargs)[source]
Plot annotation
- History:
2022-Jan-02 - Written - Henry Leung (University of Toronto)
- initialize_mwplot(fig=None, ax=None, _multi=False)[source]
Internal method to initial mw_plot images and plot
- Returns:
None
- mw_density(x, y, c, **kwargs)[source]
Plot desnity with colorbar
- Parameters:
x (astropy.Quantity) – Scatter points x-coordinates on the plot
y (astropy.Quantity) – Scatter points y-coordinates on the plot
c (Union[str, list, ndarry]) – Scatter points color
title (str) – Plot title
- History:
2018-Mar-17 - Written - Henry Leung (University of Toronto)
- mw_scatter(x, y, c='r', **kwargs)[source]
Plot scatter points with colorbar
- Parameters:
x (astropy.Quantity) – Scatter points x-coordinates on the plot
y (astropy.Quantity) – Scatter points y-coordinates on the plot
c (Union[str, list, ndarry]) – Scatter points color
- History:
2018-Mar-17 - Written - Henry Leung (University of Toronto)
- scatter_annotate(text, position, arrowprops={'facecolor': 'black', 'headlength': 6.0, 'headwidth': 6.0, 'width': 1.0}, fontsize=15, bbox={'pad': 2}, **kwargs)[source]
Plot annotation with scatter
- History:
2022-Jan-02 - Written - Henry Leung (University of Toronto)
- static transparent_cmap(cmap, N=255)[source]
Copy colormap and set alpha values
- Parameters:
cmap (Union[matplotlib.colors.ListedColormap, str]) – Color map to covert to transparent color map
N (int) – Color map to covert to transparent color map
- Returns:
Transparent color map
- Rtype cmap:
matplotlib.colors.ListedColormap
- class mw_plot.MWSkyMap(projection='equirectangular', center=<Quantity [0., 0.] deg>, radius=<Quantity [180., 90.] deg>, grayscale=False, grid=False, radecgrid=False, eclgrid=False, figsize=(10, 6.5), dpi=None)[source]
MWSkyMap class plotting with Matplotlib
- Parameters:
projection (string(["equirectangular", "aitoff", "hammer", "lambert", "mollweide"])) – projection system of the plot
center (astropy.Quantity) – Coordinates of the center of the plot with astropy degree/radian units
radius (astropy.Quantity) – Radius of the plot with astropy degree/radian units
grayscale (bool) – whether to use grayscale background
grid (bool) – whether to show galactic grid
radecgrid (bool) – whether to show ra & dec grid
eclgrid (bool) – whether to show ecliptic grid
figsize (turple) – Matplotlib figure size
dpi (int) – Matplotlib figure dpi
- annotate(*args, **kwargs)[source]
Plot annotation
- History:
2022-Jan-02 - Written - Henry Leung (University of Toronto)
- initialize_mwplot(fig=None, ax=None, _multi=False)[source]
Initial mw_plot images and plot
- Returns:
None
- mw_scatter(ra, dec, c='r', **kwargs)[source]
Plot scatter points with colorbar
- Parameters:
ra (astropy.Quantity) – Scatter points x-coordinates on the plot
dec (astropy.Quantity) – Scatter points y-coordinates on the plot
c (Union[str, list, ndarry]) – Scatter points color
- History:
2018-Mar-17 - Written - Henry Leung (University of Toronto)
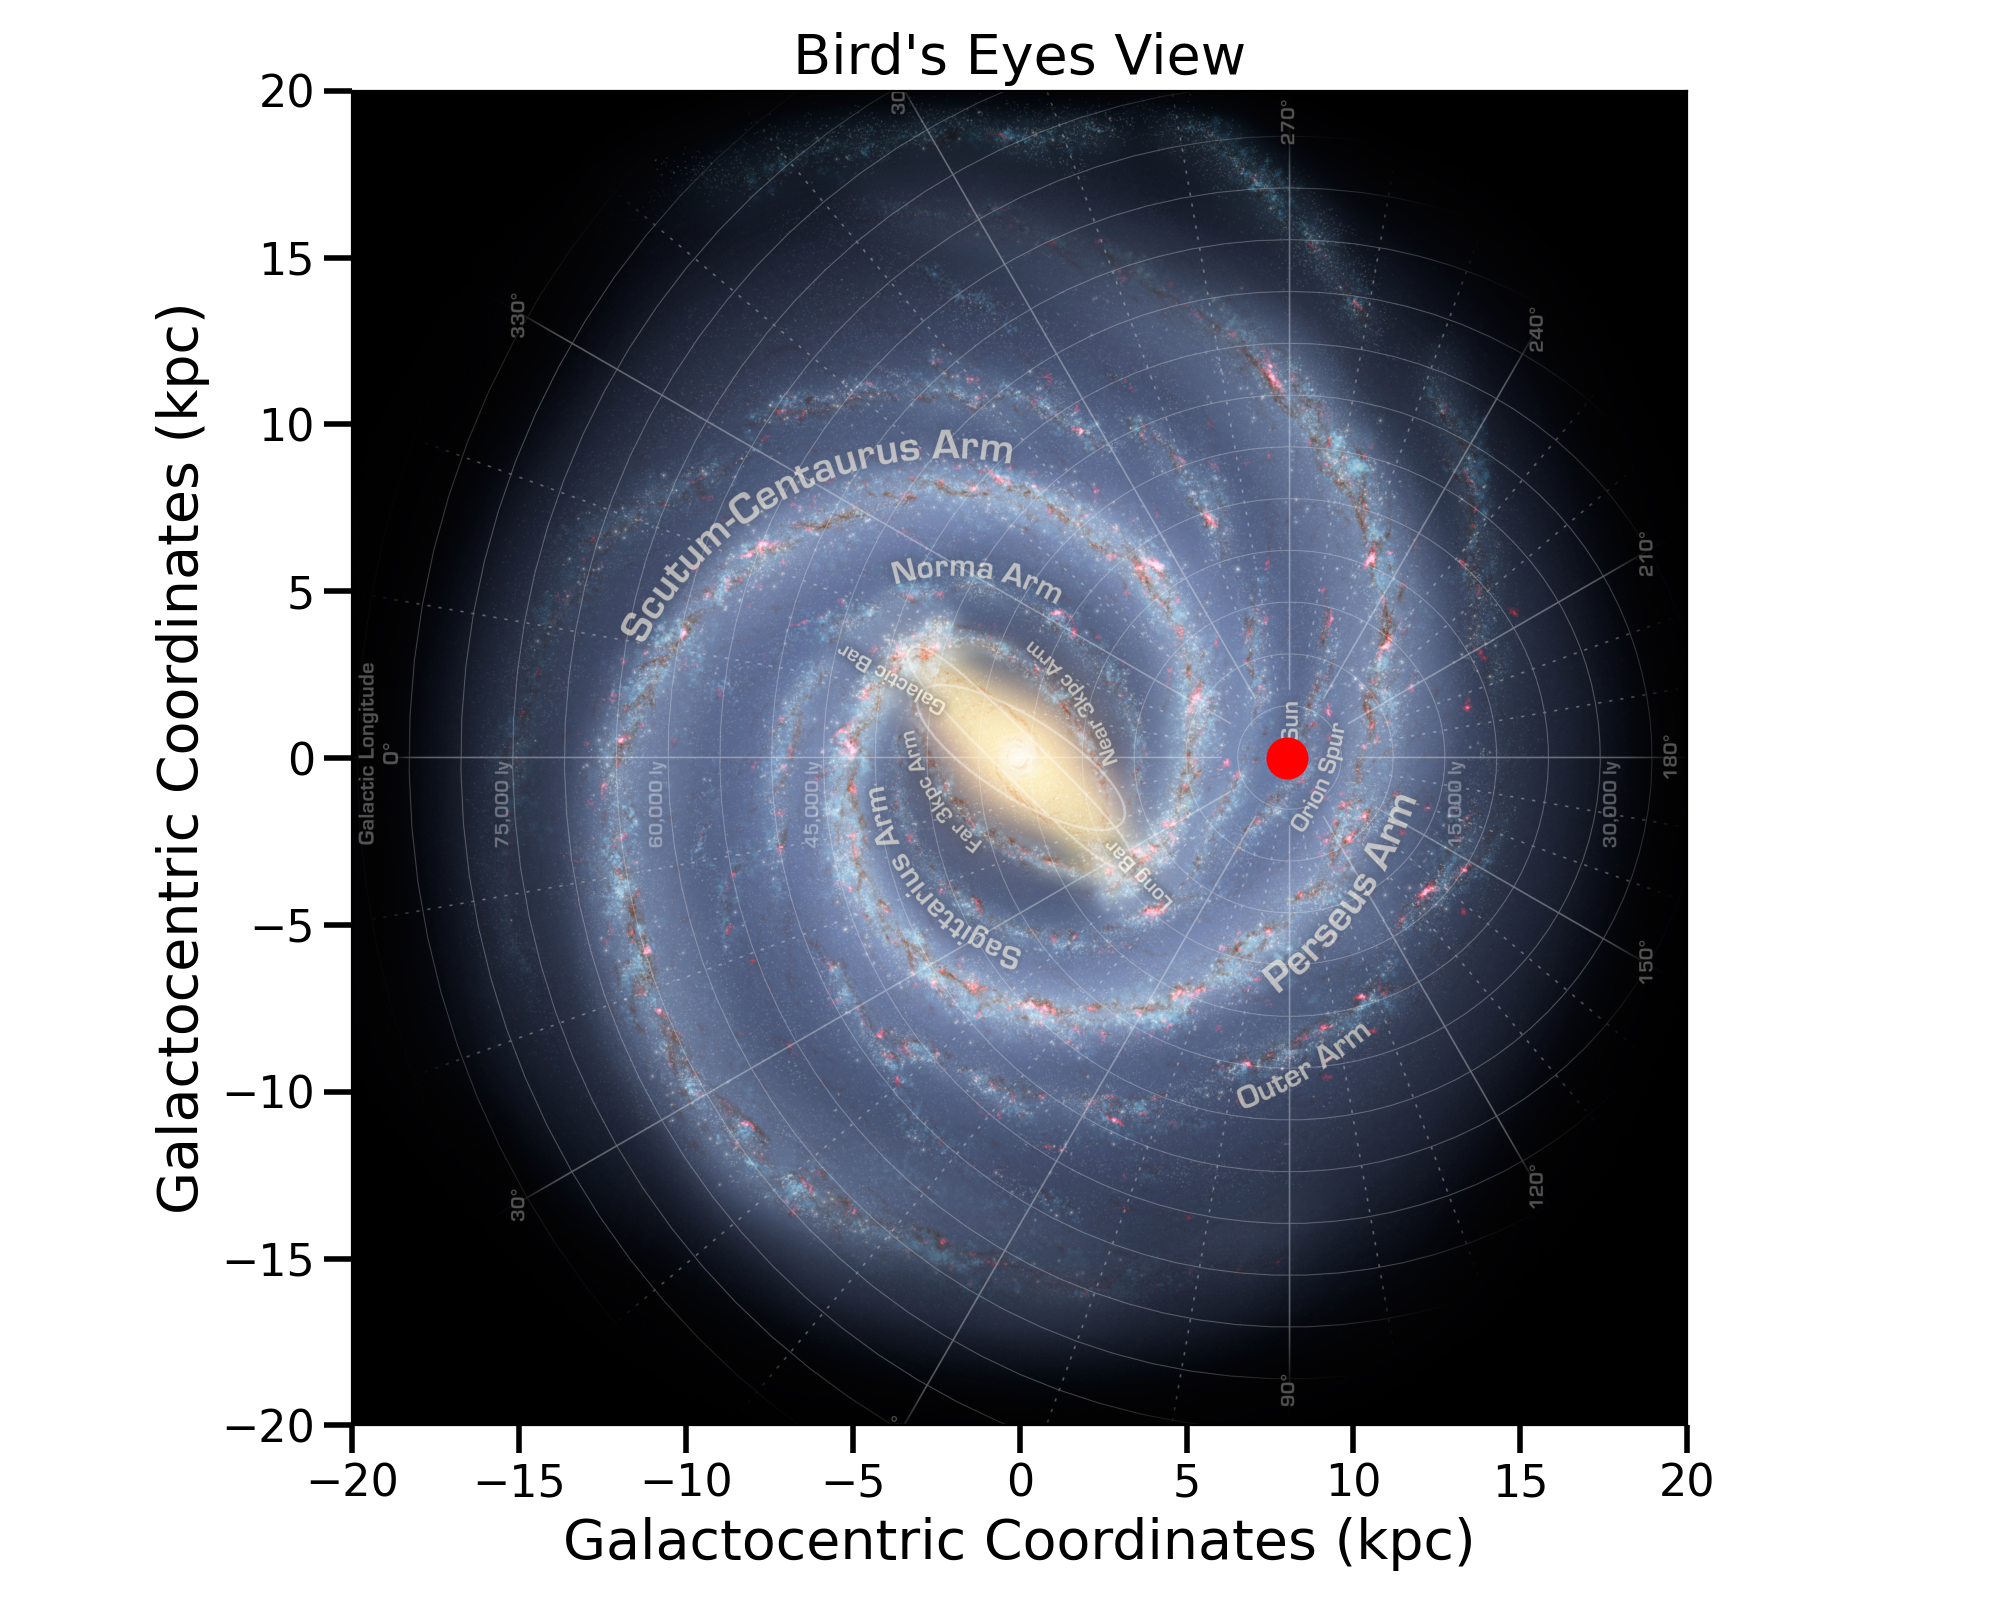
MilkyWay Bird’s Eye
 1import numpy as np
 2from astropy import units as u
 3from mw_plot import MWPlot
 4
 5# setup a mw-plot instance of bird's eye view of the disc
 6mw1 = MWPlot(
 7    radius=20 * u.kpc,
 8    unit=u.kpc,
 9    coord="galactocentric",
10    annotation=True,
11    figsize=(10, 8),
12)
13
14# set up plot title
15mw1.title = "Bird's Eyes View"
16
17mw1.scatter(8 * u.kpc, 0 * u.kpc, c="r", s=200)
(Source code, png, pdf)

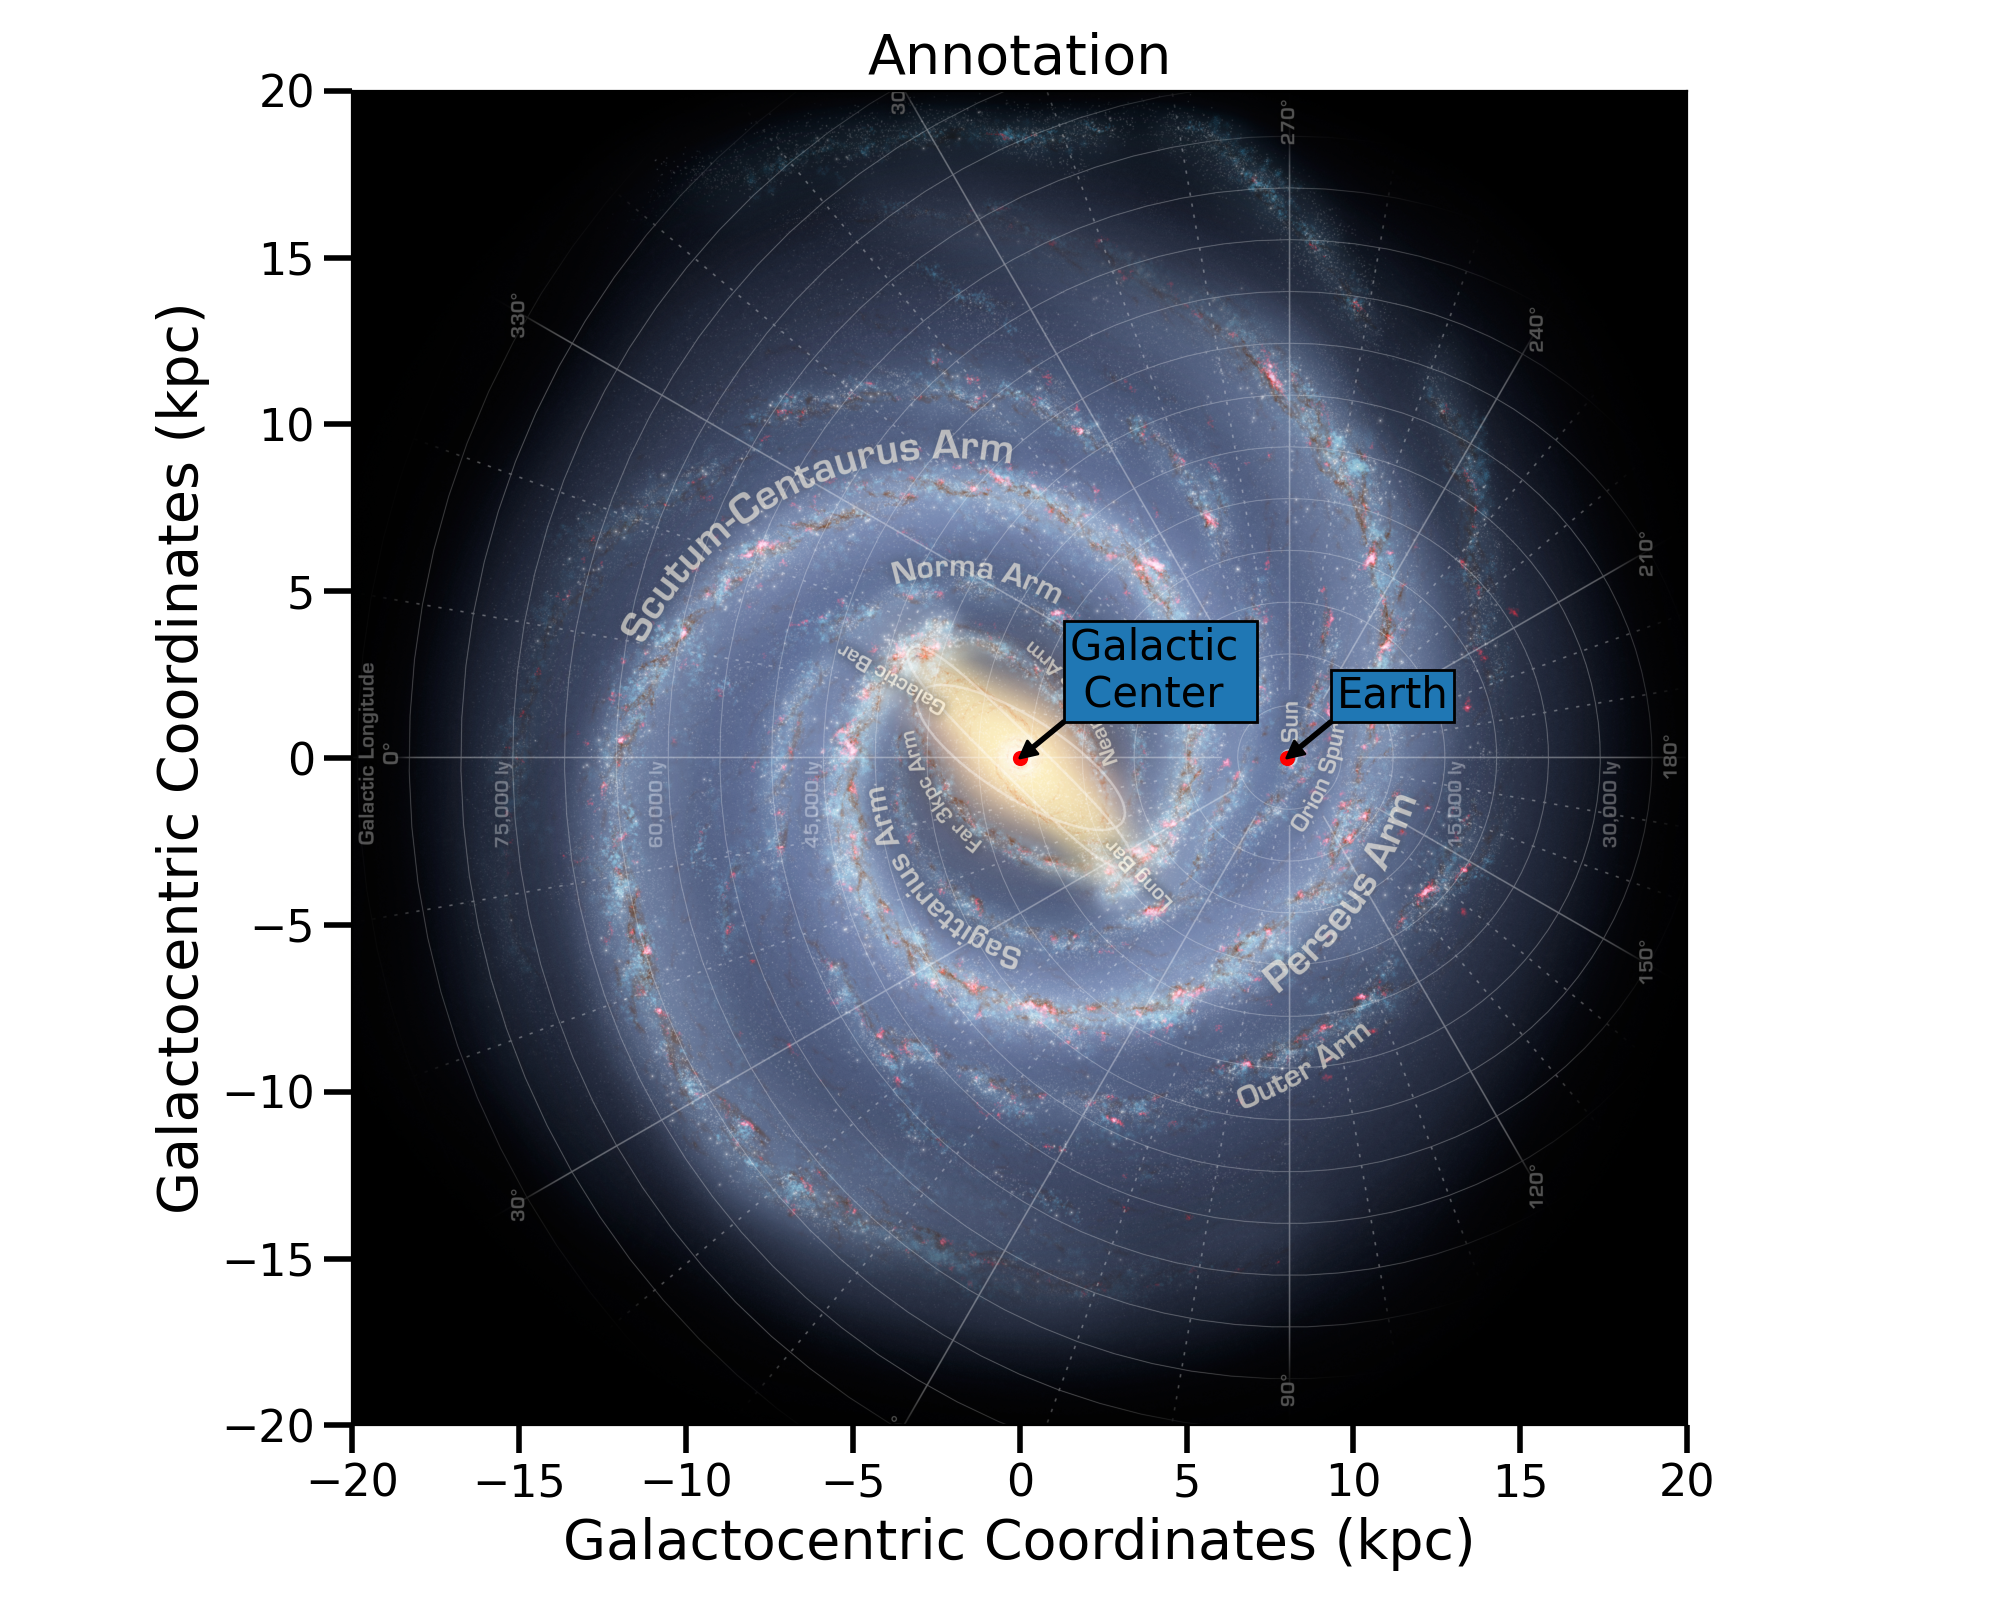
Annotation
 1import numpy as np
 2from astropy import units as u
 3from mw_plot import MWPlot
 4
 5mw1 = MWPlot(radius=20 * u.kpc, unit=u.kpc, coord="galactocentric", annotation=True, figsize=(10, 8),)
 6
 7# set up plot title
 8mw1.title = "Annotation"
 9
10mw1.scatter_annotate(["Earth", "Galactic \n Center"], [[8.0, 0.0], [0.0, 0.0]] * u.kpc)
(Source code, png, pdf)

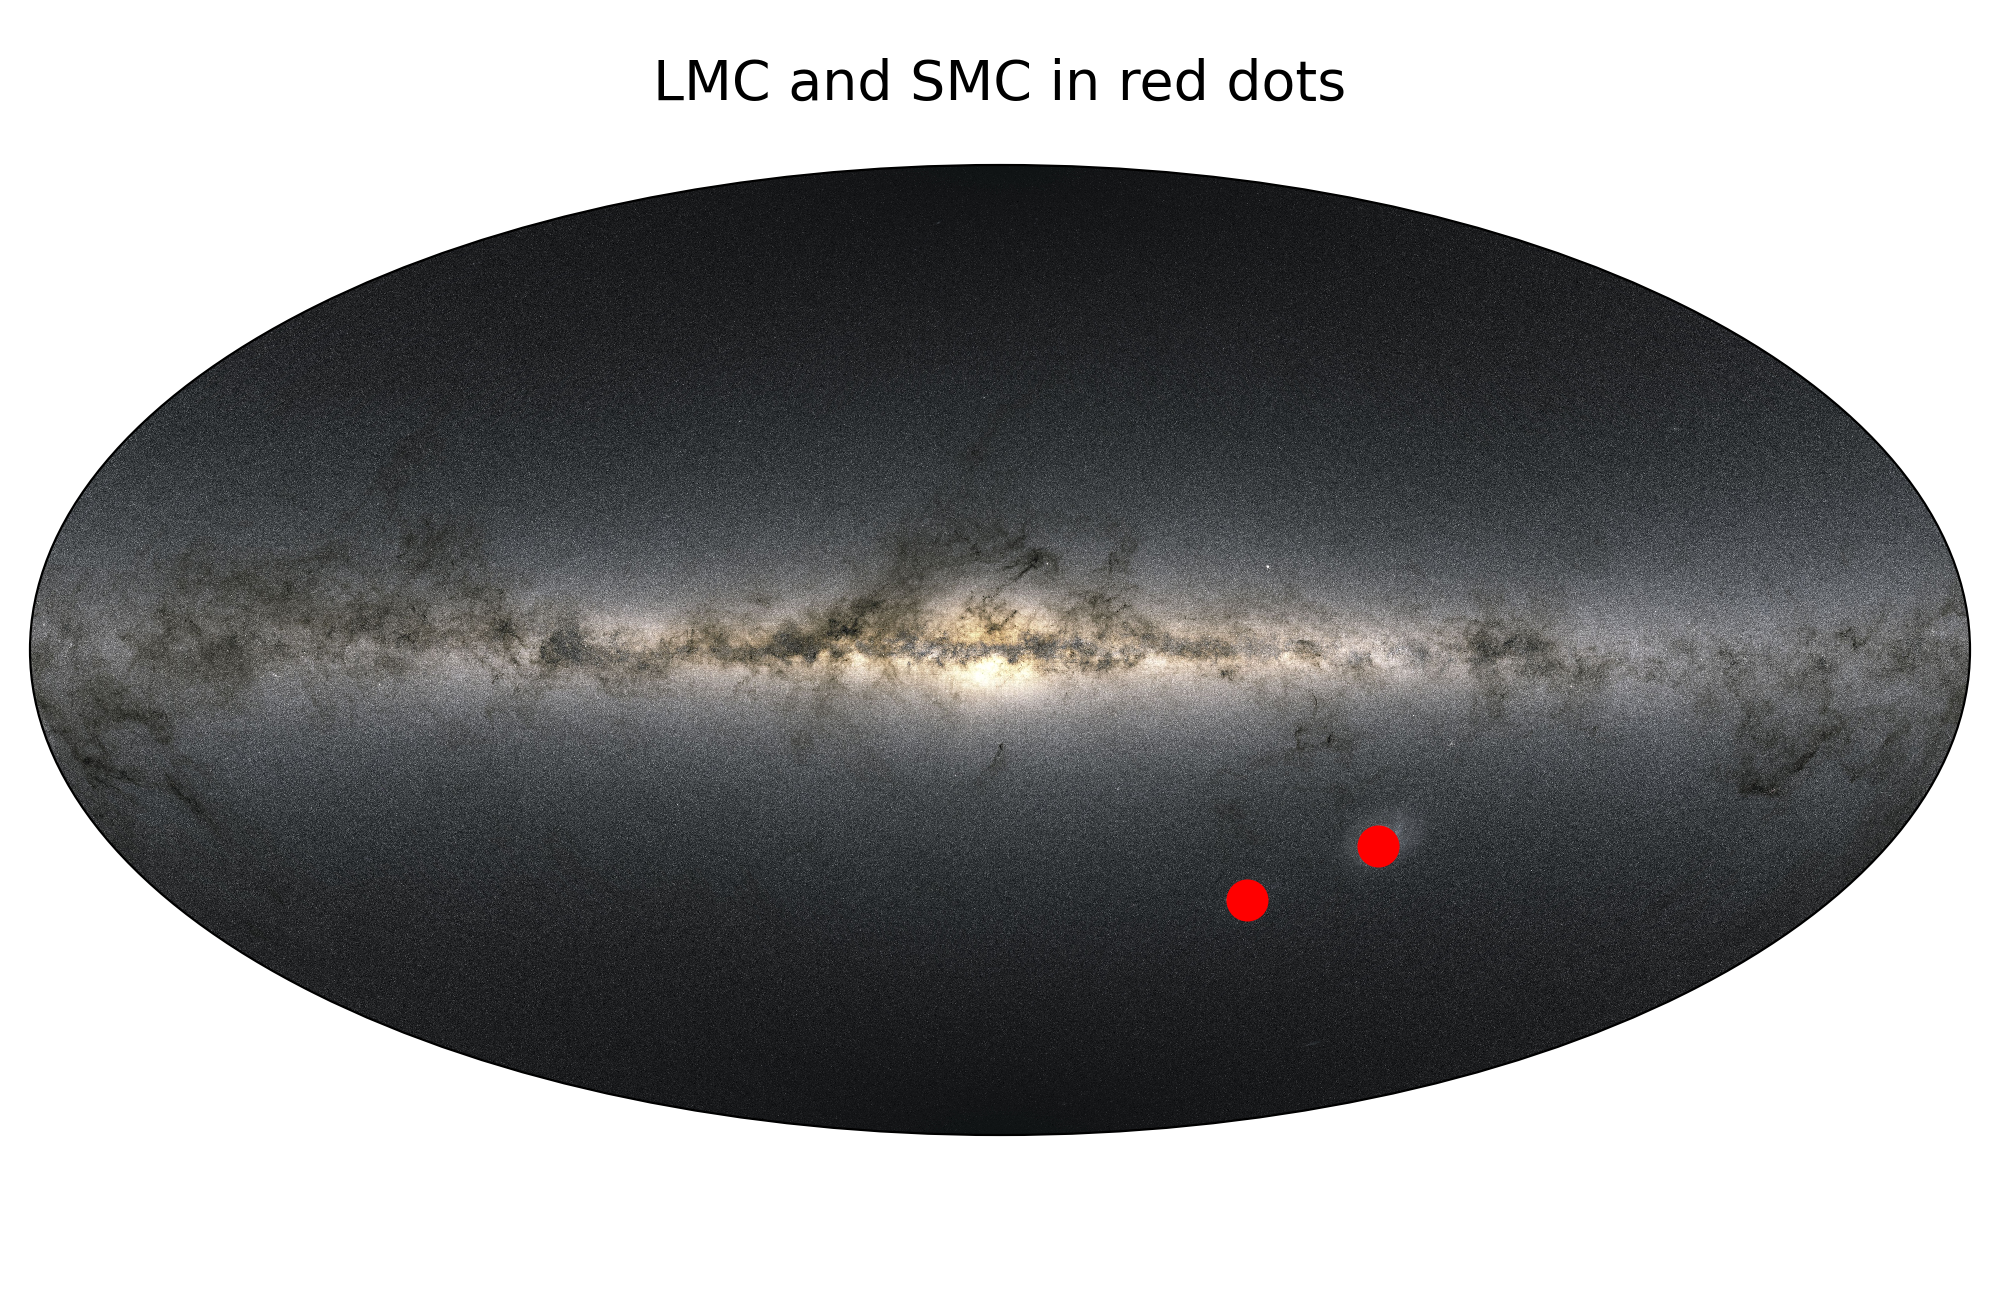
MilkyWay Sky Map
 1import numpy as np
 2from astropy import units as u
 3from mw_plot import MWSkyMap
 4
 5# setup a MWSkyMap instance with projection, other projection can be 'hammer', 'mollweide' etc
 6# grayscale: whether to turn the background image to grayscale
 7mw1 = MWSkyMap(projection="aitoff", grayscale=False)
 8
 9# set up plot title
10mw1.title = "LMC and SMC in red dots"
11
12# LMC and SMC coordinates
13lsmc_ra = [78.77, 16.26] * u.degree
14lsmc_dec = [-69.01, -72.42] * u.degree
15
16mw1.scatter(lsmc_ra, lsmc_dec, c="r", s=200)
(Source code, png, pdf)

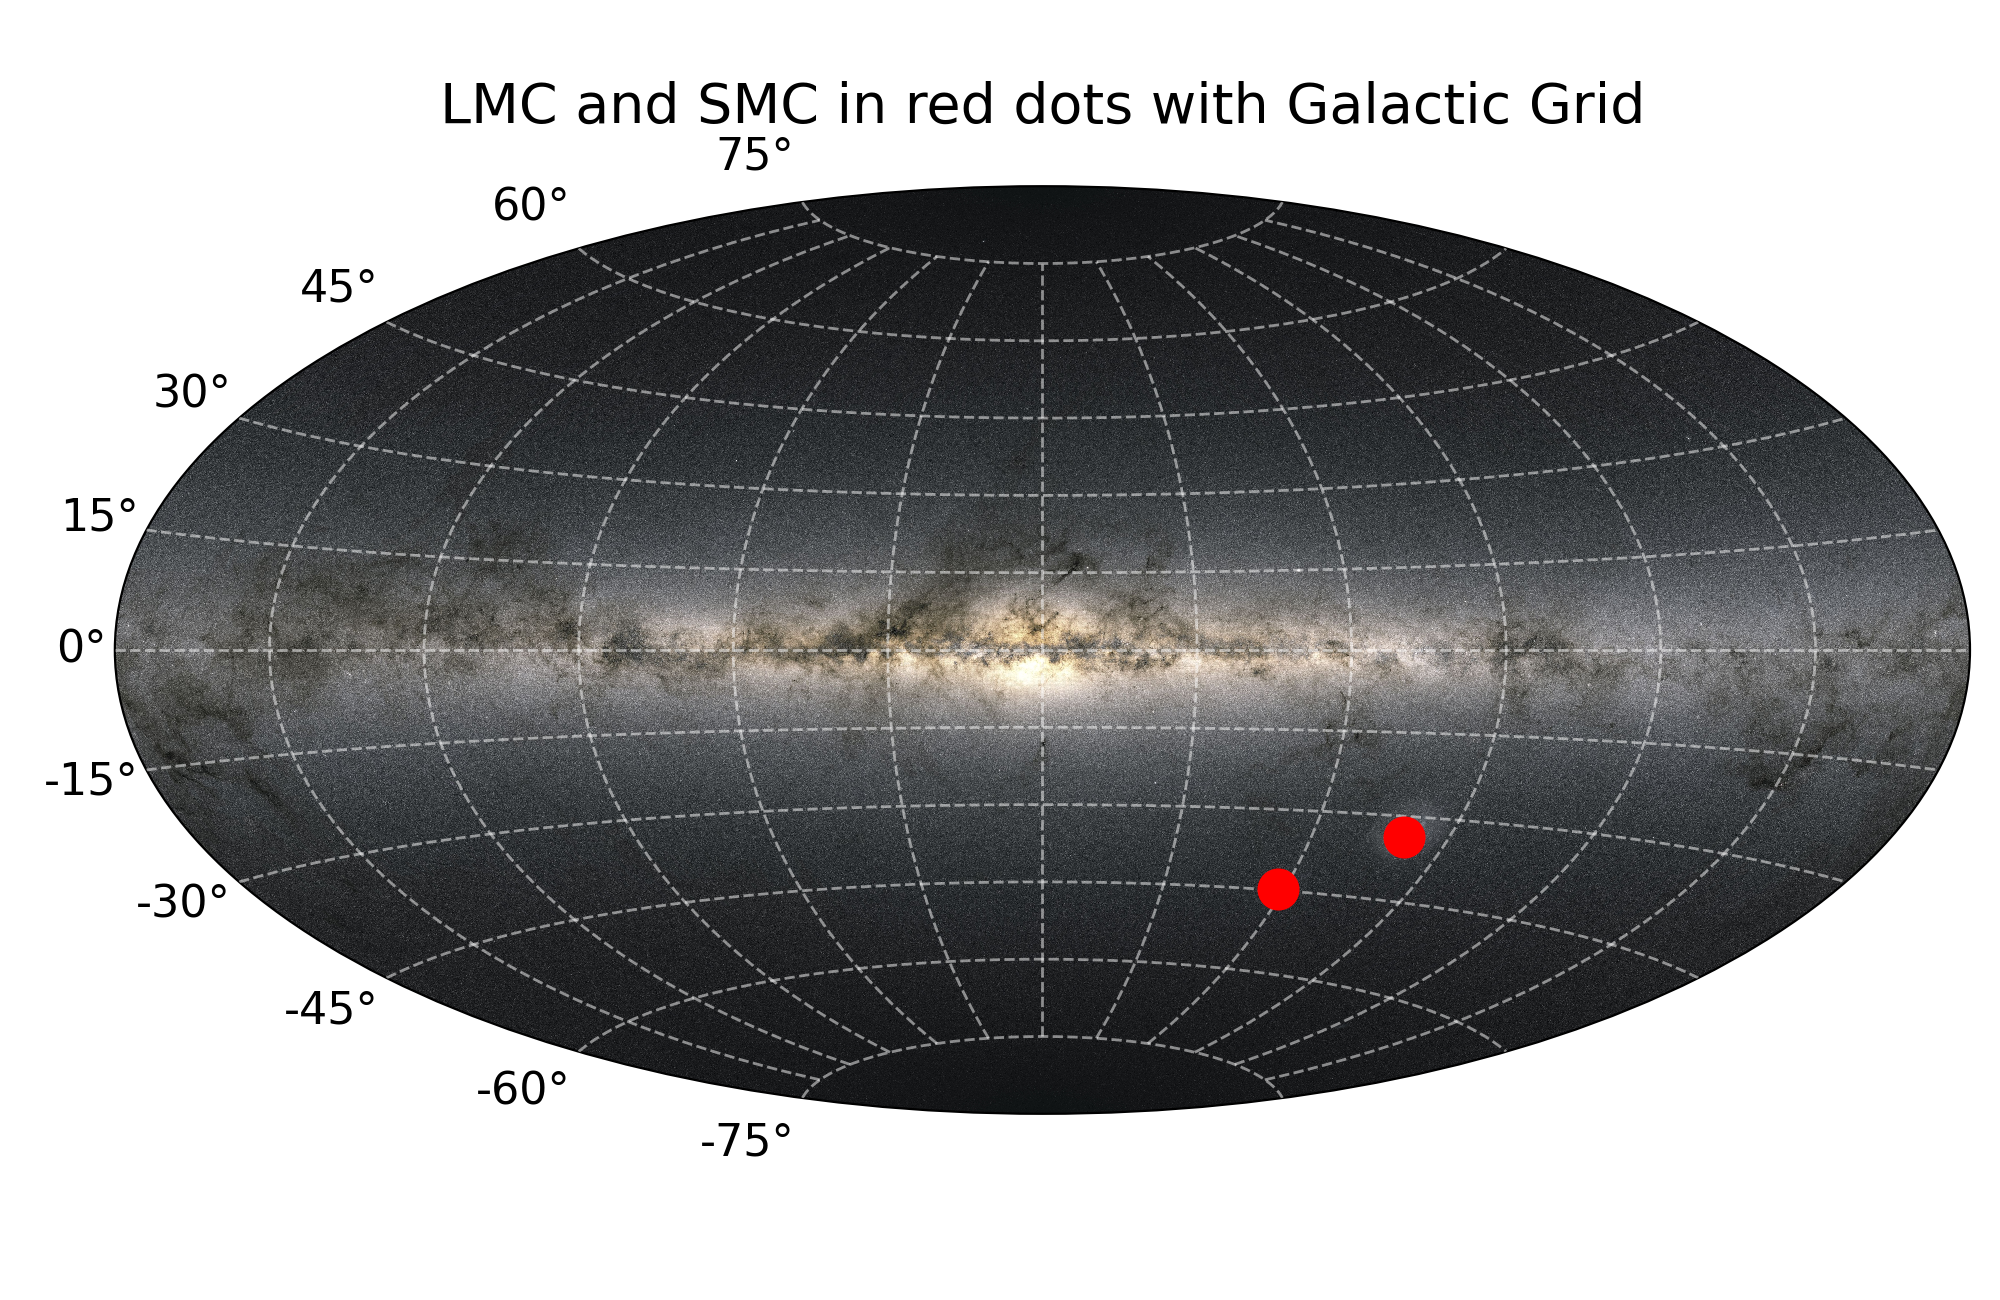
You can also plot with grid
 1import numpy as np
 2from astropy import units as u
 3from mw_plot import MWSkyMap
 4
 5# setup a MWSkyMap instance with projection, other projection can be 'hammer', 'mollweide' etc
 6# grid: whether to show the Galactic grid
 7mw1 = MWSkyMap(projection="aitoff", grid=True)
 8
 9# set up plot title
10mw1.title = "LMC and SMC in red dots with Galactic Grid"
11
12# LMC and SMC coordinates
13lsmc_ra = [78.77, 16.26] * u.degree
14lsmc_dec = [-69.01, -72.42] * u.degree
15
16mw1.scatter(lsmc_ra, lsmc_dec, c="r", s=200)
(Source code, png, pdf)
1import numpy as np
2from astropy import units as u
3from mw_plot import MWSkyMap
4
5# setup a MWSkyMap instance with projection, other projection can be 'hammer', 'mollweide' etc
6# radecgrid: whether to show the RA/DEC grid
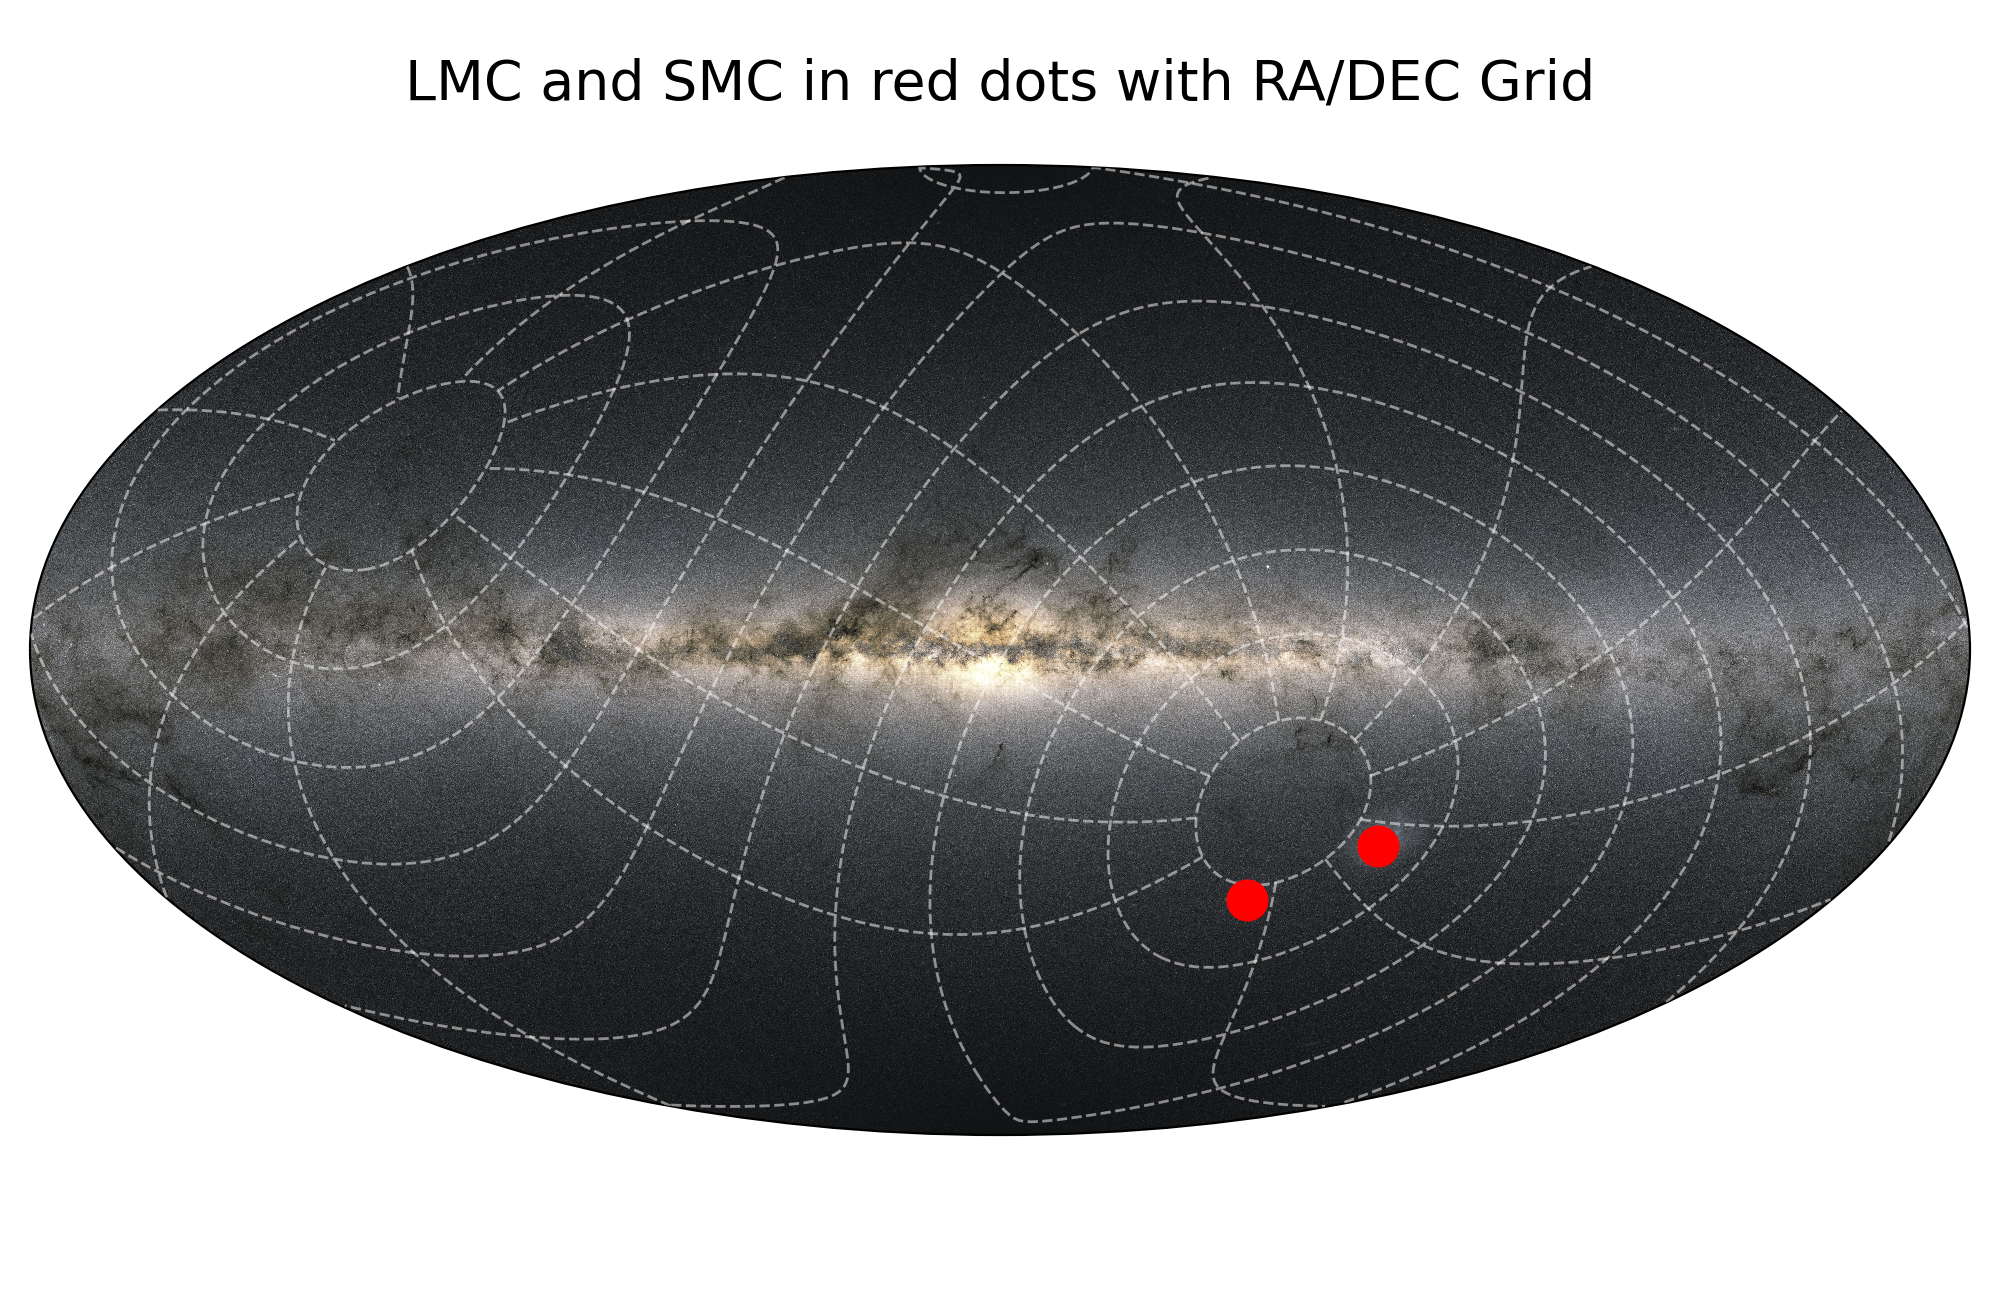
7mw1 = MWSkyMap(projection="aitoff", radecgrid=True)
8
9# set up plot title
10mw1.title = "LMC and SMC in red dots with RA/DEC Grid"
11
12# LMC and SMC coordinates
13lsmc_ra = [78.77, 16.26] * u.degree
14lsmc_dec = [-69.01, -72.42] * u.degree
15
16mw1.scatter(lsmc_ra, lsmc_dec, c="r", s=200)
(Source code, png, pdf)
 1import numpy as np
 2from astropy import units as u
 3from mw_plot import MWSkyMap
 4
 5# setup a MWSkyMap instance with projection, other projection can be 'hammer', 'mollweide' etc
 6# radecgrid: whether to show the RA/DEC grid
 7mw1 = MWSkyMap(projection="aitoff", eclgrid=True)
 8
 9# set up plot title
10mw1.title = "LMC and SMC in red dots with Ecliptic Grid"
11
12# LMC and SMC coordinates
13lsmc_ra = [78.77, 16.26] * u.degree
14lsmc_dec = [-69.01, -72.42] * u.degree
15
16mw1.scatter(lsmc_ra, lsmc_dec, c="r", s=200)
(Source code, png, pdf)
