Matplotlib Gallery
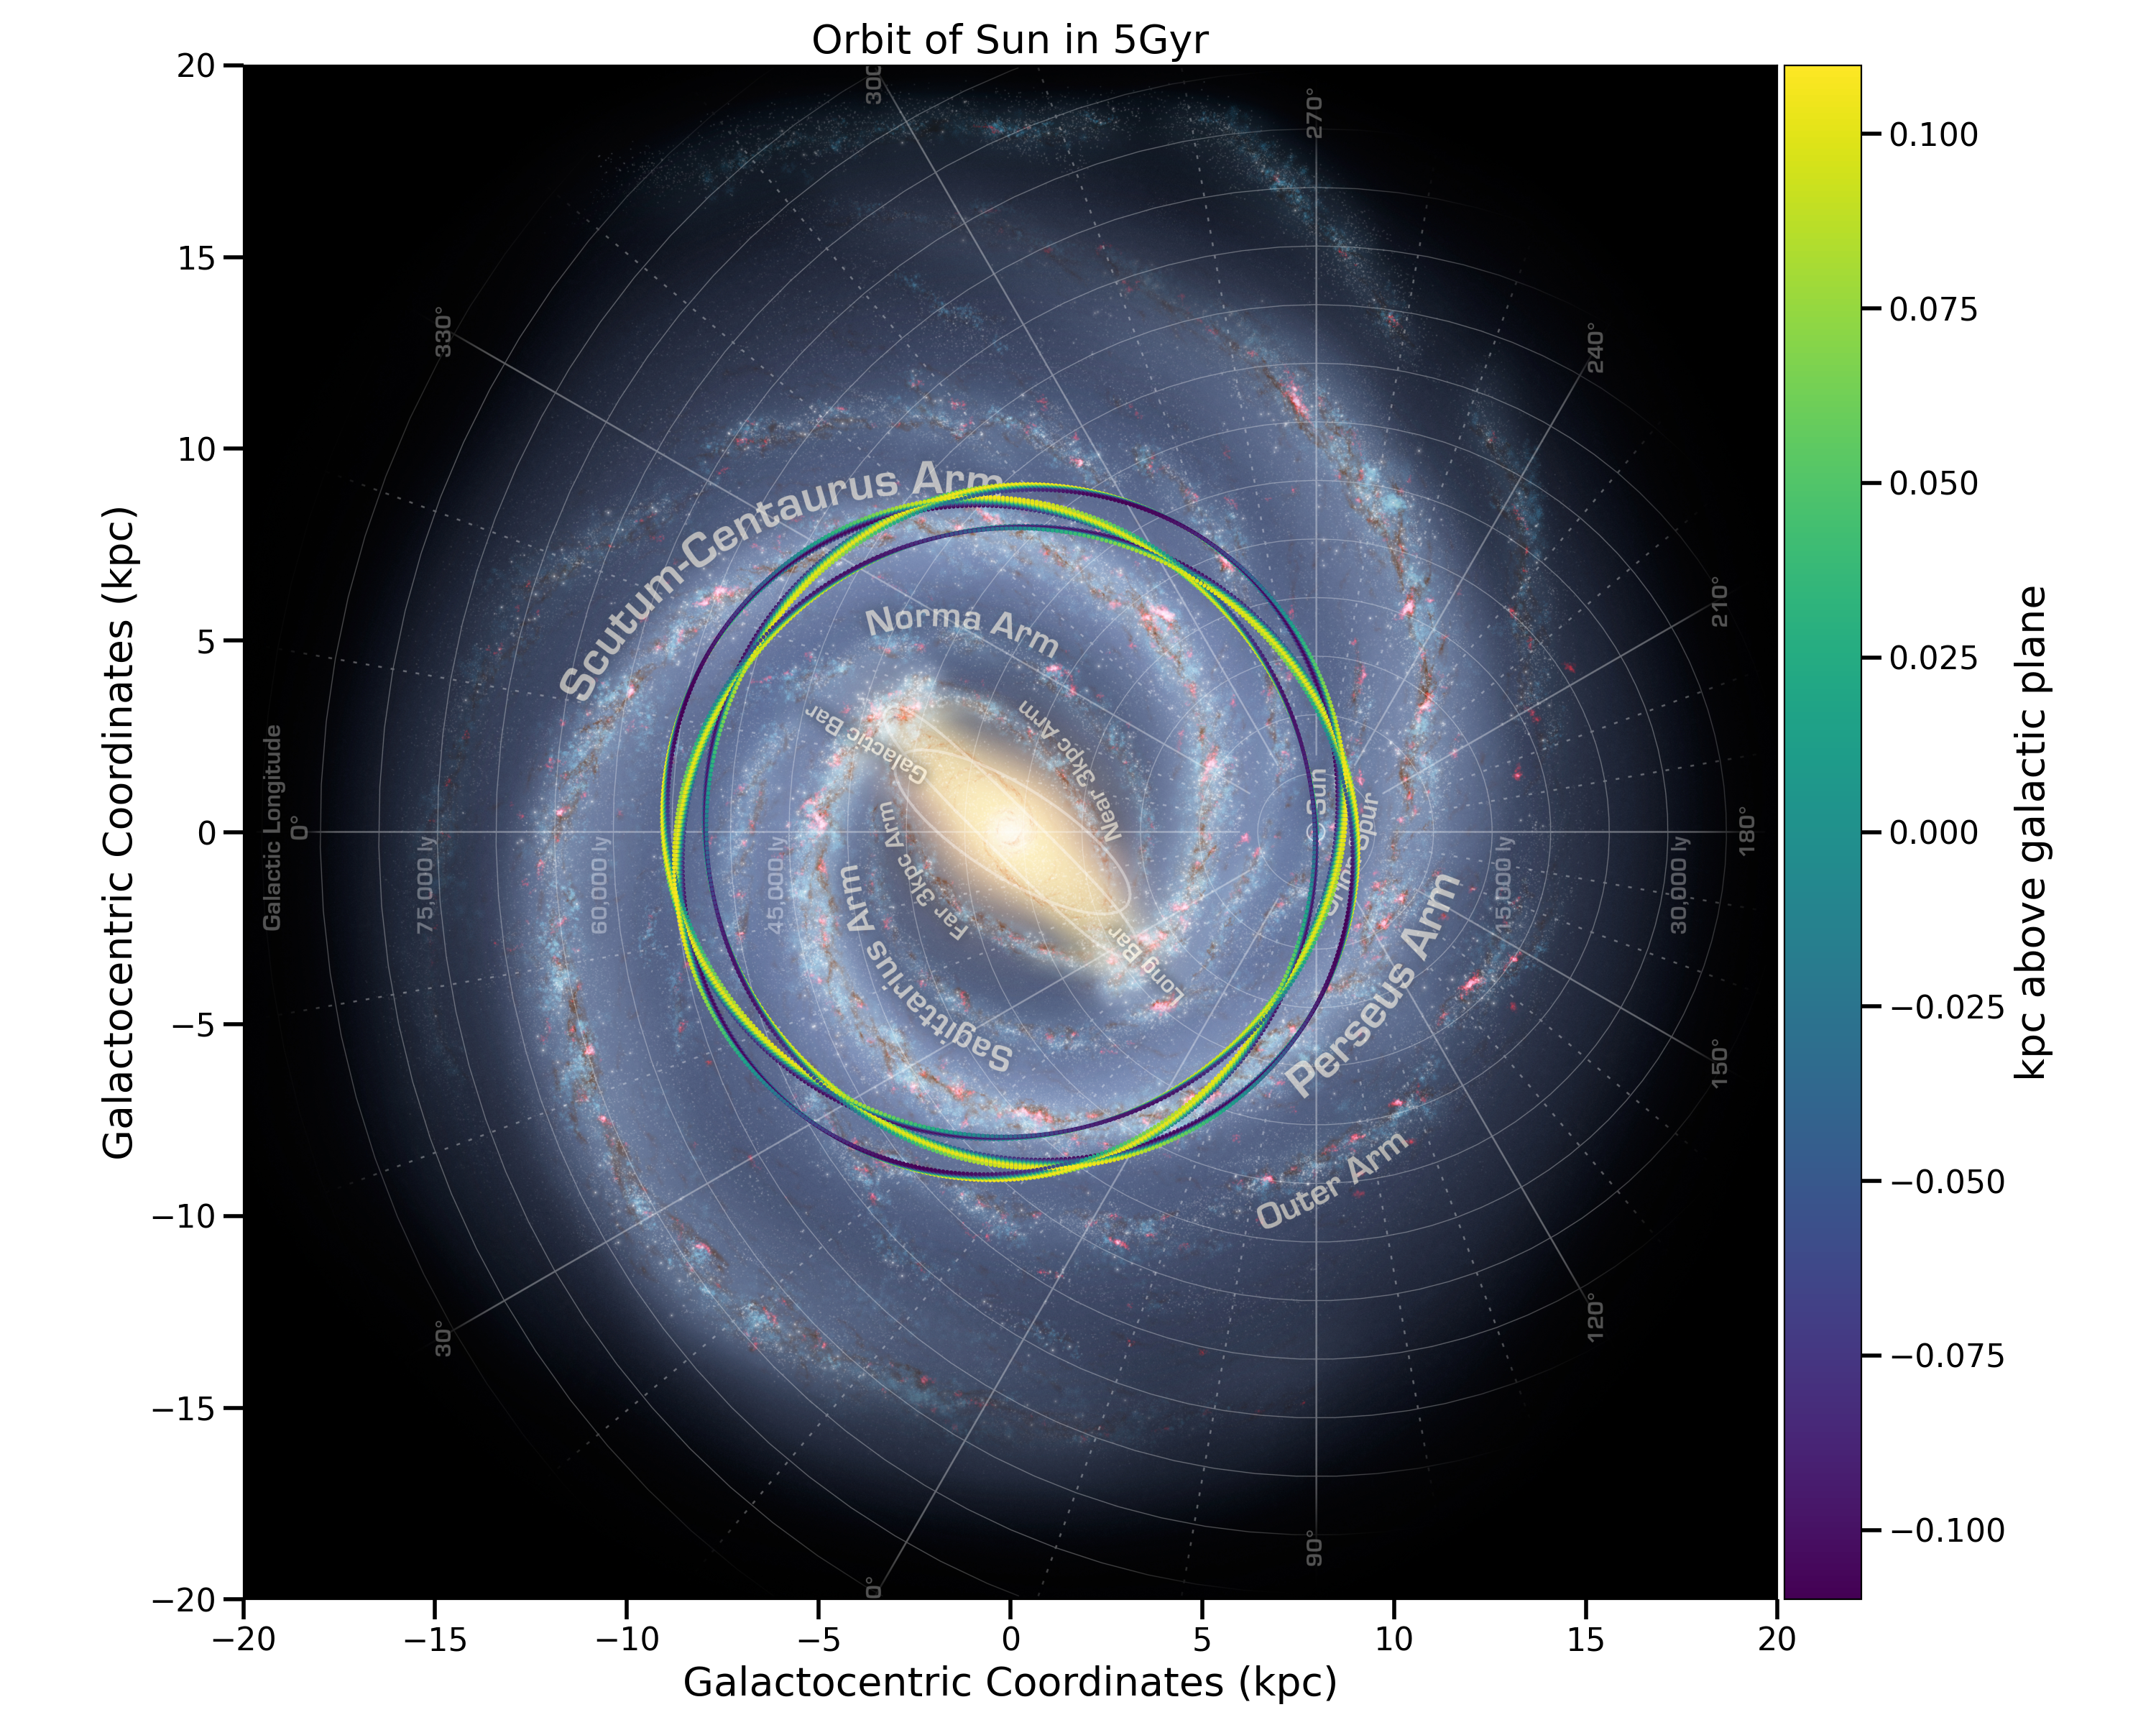
Orbit of Sun
 1from mw_plot import MWPlot
 2
 3from galpy.potential import MWPotential2014
 4from galpy.orbit import Orbit
 5import numpy as np
 6from astropy import units as u
 7
 8# Orbit Integration using galpy for the Sun
 9op = Orbit([0., 0., 0., 0., 0., 0.], radec=True, ro=8., vo=220.)
10ts = np.linspace(0, 5, 10000) * u.Gyr
11op.integrate(ts, MWPotential2014)
12x = op.x(ts) * u.kpc
13y = op.y(ts) * u.kpc
14z = op.z(ts)
15
16# setup a mw-plot instance of bird's eye view of the disc
17mw1 = MWPlot(radius=20 * u.kpc, unit=u.kpc, coord='galactocentric', annotation=True, figsize=(15, 12), r0=8)
18
19# set up plot title
20mw1.title = 'Orbit of Sun in 5Gyr'
21
22# use mw_scatter instead of scatter because we want a colorbar
23mw1.mw_scatter(x, y, c=[z, 'kpc above galactic plane'], s=1)
(Source code, png, pdf)
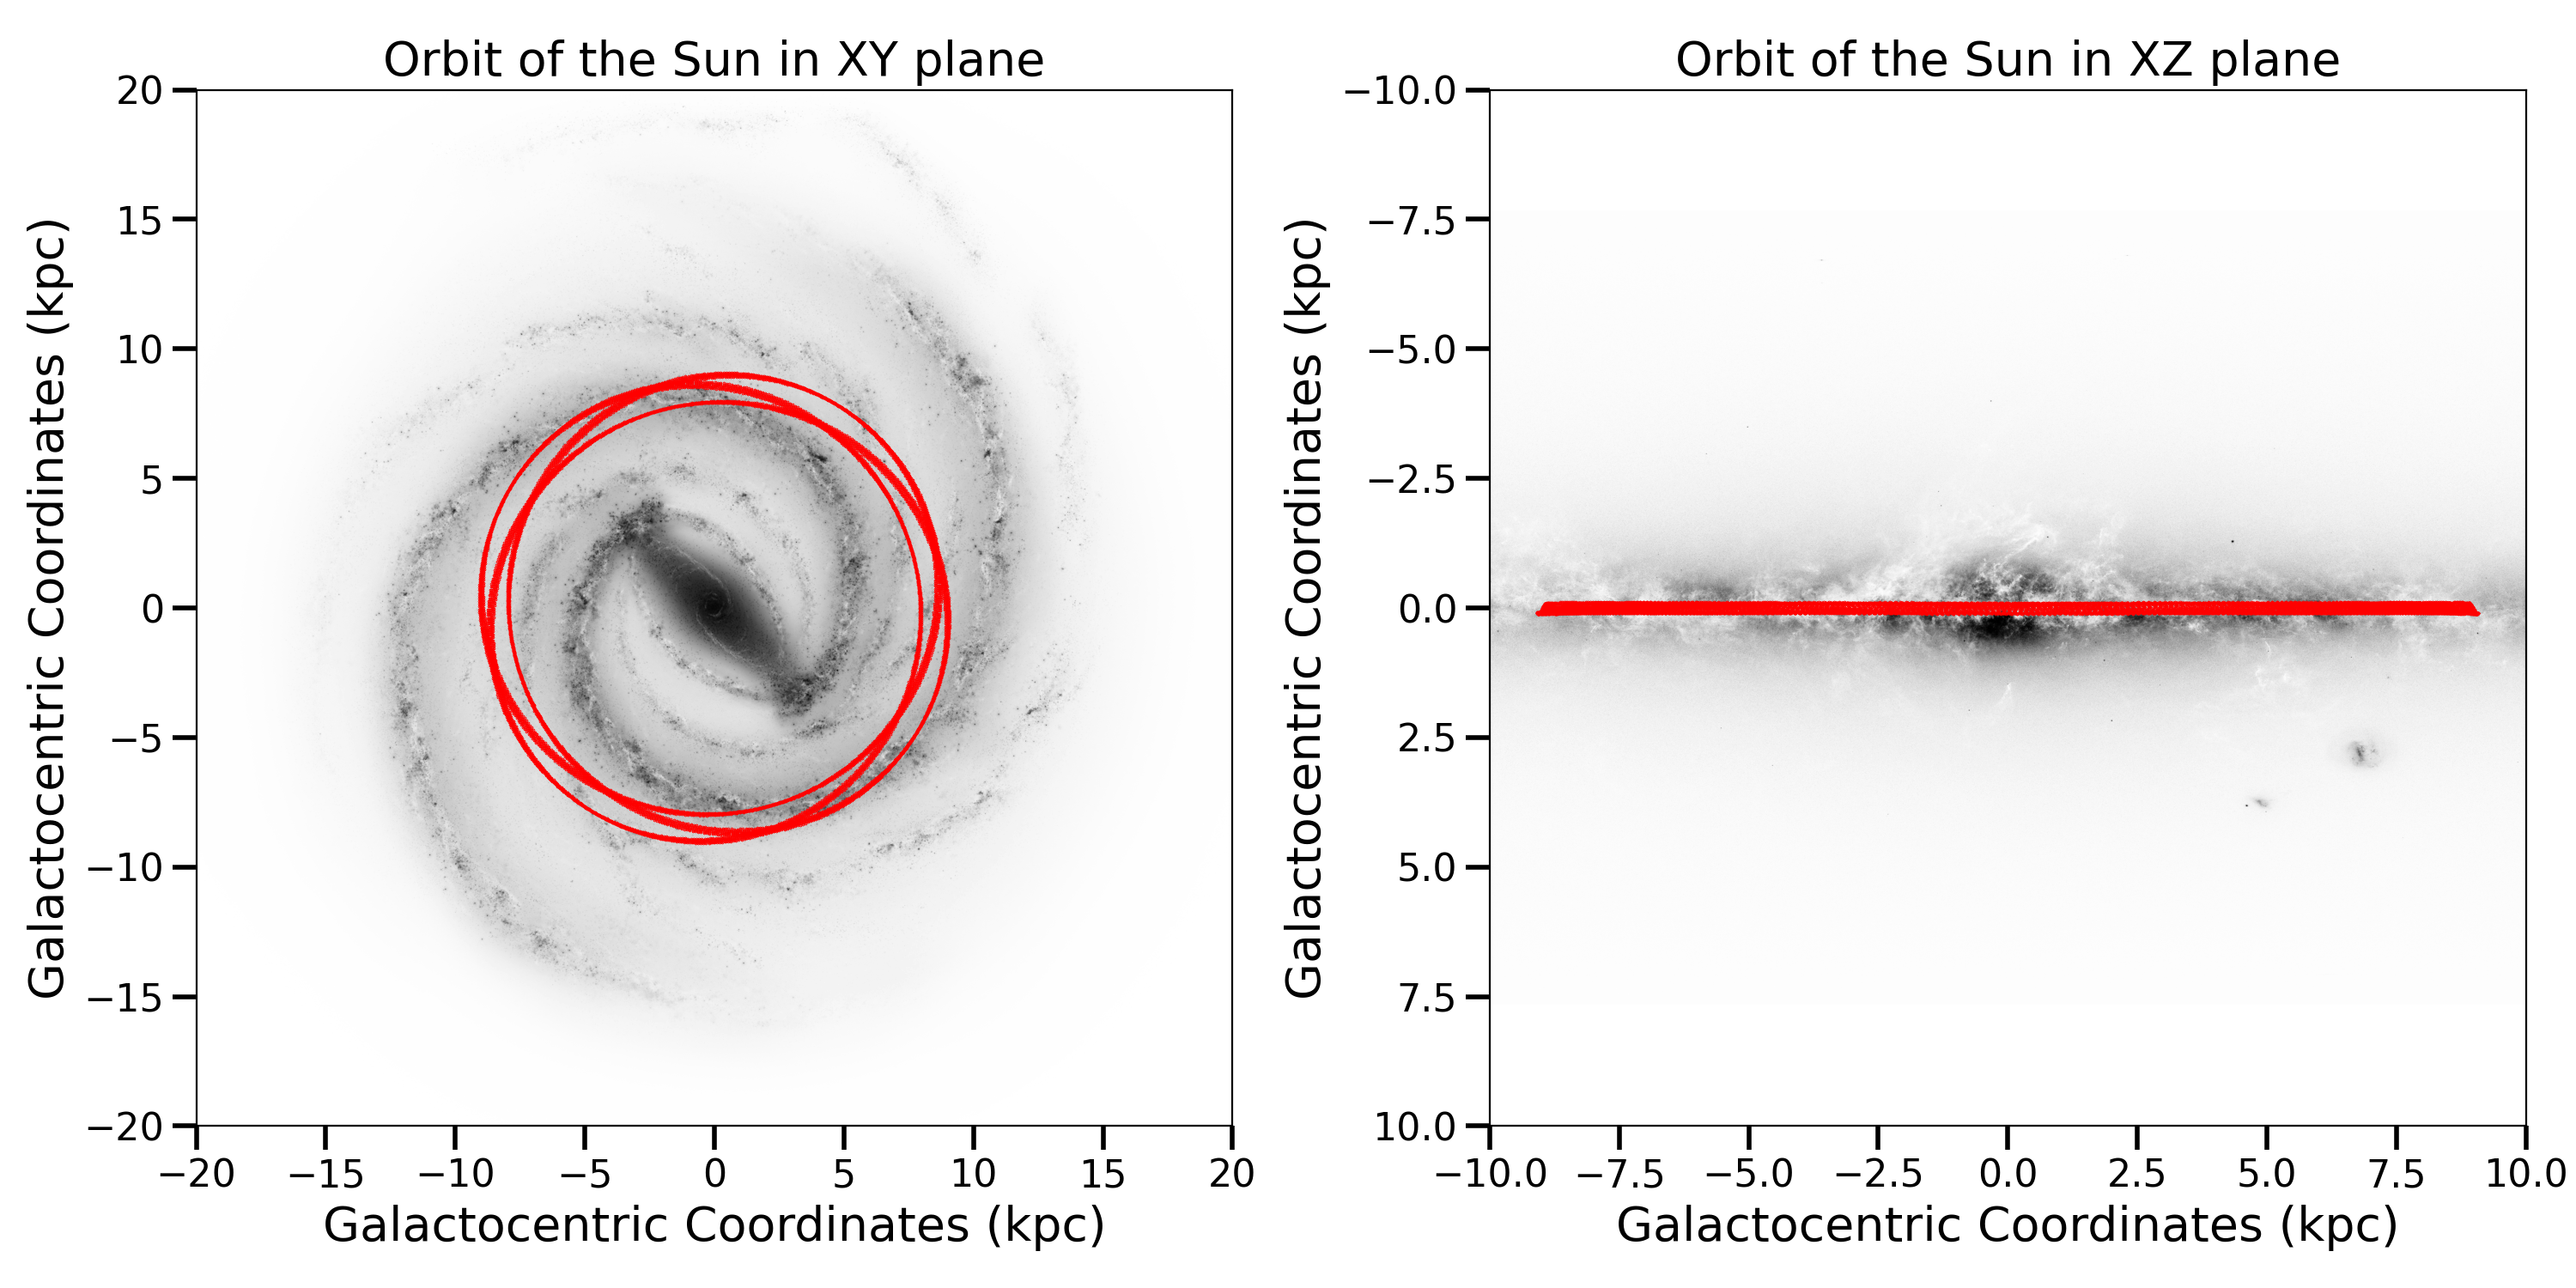
Orbit of Sun 2
 1import pylab as plt
 2from mw_plot import MWPlot
 3from astropy import units as  u
 4from galpy.potential import MWPotential2014
 5from galpy.orbit import Orbit
 6import numpy as np
 7
 8# Orbit Integration using galpy for the Sun
 9op = Orbit([0., 0., 0., 0., 0., 0.], radec=True, ro=8., vo=220.)
10ts = np.linspace(0, 5, 10000) * u.Gyr
11op.integrate(ts, MWPotential2014)
12x = op.x(ts) * u.kpc
13y = op.y(ts) * u.kpc
14z = op.z(ts)
15
16# setup a mw-plot instance of bird's eye view of the disc
17mw1 = MWPlot(radius=20 * u.kpc, center=(0, 0)*u.kpc, unit=u.kpc, coord='galactocentric', annotation=False, grayscale=True)
18mw2 = MWPlot(radius=10 * u.kpc, mode="edge-on", center=(0, 0)*u.kpc, unit=u.kpc, coord='galactocentric', annotation=False, grayscale=True)
19
20# setup subplots with matplotlib
21fig, (ax1, ax2) = plt.subplots(1, 2, figsize=(15, 7.5))
22
23# transform the whole figure with mw-plot
24# mw1.transform([ax1, ax2]) will have the same effect
25mw1.transform(ax1)
26mw2.transform(ax2)
27
28# you can plot something on top of the transformed subplot
29ax1.scatter(x, y, c='r', s=0.1)
30ax2.scatter(x, z, c='r', s=0.1)
31ax1.set_title("Orbit of the Sun in XY plane", fontsize=20)
32ax2.set_title("Orbit of the Sun in XZ plane", fontsize=20)
(Source code, png, pdf)